Archive
Global Income Distribution: From the Fall of the Berlin Wall to the Great Recession
Since 1988, rapid growth in Asia has lifted billions out of poverty. Incomes at the very top of the world income distribution have also grown rapidly, whereas median incomes in rich countries have grown much more slowly. This posting asks whether these developments, while reducing global income inequality overall, might undermine democracy in rich countries.
The period between the fall of the Berlin Wall and the Great Recession saw probably the most profound reshuffle of individual incomes on the global scale since the Industrial Revolution. This was driven by high growth rates of populous and formerly poor or very poor countries like China, Indonesia, and India; and, on the other hand, by the stagnation or decline of incomes in sub-Saharan Africa and post-communist countries as well as among poorer segments of the population in rich countries.

Anand and Segal (2008) offer a detailed review of the work on global income inequality. In Lakner and Milanovic (2013), we address some of the limitations of these earlier studies and present new results from detailed work on household survey data from about 120 countries over the period 1988–2008. Each country’s distribution is divided into ten deciles (each decile consists of 10% of the national population) according to their per capita disposable income (or consumption). In order to make incomes comparable across countries and time, they are corrected both for domestic inflation and differences in price levels between countries. It is then possible to observe not only how the position of different countries changes over time – as we usually do – but also how the position of various deciles within each country changes. For example, Japan’s top decile remained at the 99th (2nd highest from the top) world percentile, but Japan’s median decile dropped from the 91st to the 88th global percentile. Or, to take another example, the top Chinese urban decile moved from being in the 68th global percentile in 1988 to being in the 83rd global percentile in 2008, thus leapfrogging in the process some 15% of the world population – equivalent to almost a billion people.
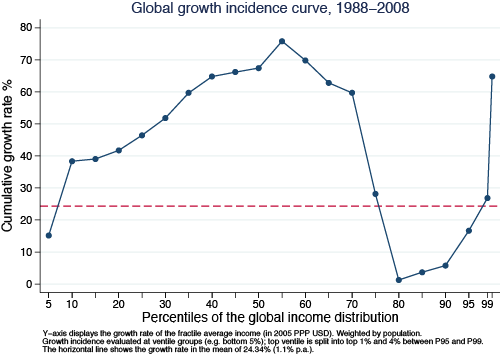
When we line up all individuals in the world, from the poorest to the richest (going from left to right on the horizontal axis in Figure 1), and display on the vertical axis the percentage increase in the real income of the equivalent group over the period 1988–2008, we generate a global growth incidence curve – the first of its kind ever, because such data at the global level were not available before. The curve has an unusual supine S shape, indicating that the largest gains were realised by the groups around the global median (50th percentile) and among the global top 1%. But after the global median, the gains rapidly decrease, becoming almost negligible around the 85th–90th global percentiles and then shooting up for the global top 1%. As a result, growth in the income of the top ventile (top 5%) accounted for 44% of the increase in global income between 1988 and 2008.
Fortunes of income deciles in different countries over time
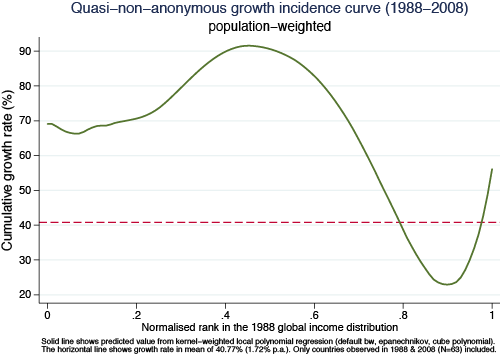
The curve in Figure 1 is drawn using a simple comparison of real income levels at given percentiles of the global income distribution in 1988 and 2008. It is ‘anonymous’ because it does not tell us what happened to the actual people who were at given global income percentiles in the initial year, 1988. In fact, the regional composition of the different global income groups changed radically over time because growth was uneven across regions. A ‘quasi non-anonymous’ growth incidence curve in Figure 2 adjusts for this – the growth rates are calculated for all individual country/deciles at the positions they held in the initial year (1988). The growth rate on the vertical axis (calculated from a non-parametric fit) thus shows how the country/deciles that were poor, middle-class, rich, etc. in 1988 performed over the next 20 years. The supine S shape still remains, although it is now slightly less dramatic.
People around the median almost doubled their real incomes. Not surprisingly, 9 out of 10 such ‘winners’ were from the ‘resurgent Asia’. For example, a person around the middle of the Chinese urban income distribution saw his or her 1988 real income multiplied by a factor of almost 3; someone in the middle of the Indonesian or Thai income distribution by a factor of 2, Indian by a factor of 1.4, etc.
It is perhaps less expected that people who gained the least were almost entirely from the ‘mature economies’ – OECD members that include also a number of former communist countries. But even when the latter are excluded, the overwhelming majority in that group of ‘losers’ are from the ‘old, conventional’ rich world. But not just anyone from the rich world. Rather, the ‘losers’ were predominantly the people who in their countries belong to the lower halves of national income distributions. Those around the median of the German income distribution have gained only 7% in real terms over 20 years; those in the US, 26%. Those in Japan lost out in real terms.
The particular supine S-shaped growth incidence curve (Figure 1) does not allow us to immediately tell whether global inequality might have gone up or down because the gains around the median (which tend to reduce inequality) may be offset by the gains of the global top 1% (which tend to increase inequality). On balance, however, it turns out that the first element dominates, and that global inequality – as measured by most conventional indicators – went down. The global Gini coefficient fell by almost 2 Gini points (from 72.2 to 70.5) during the past 20 years of globalisation. Was it then all for the better?
Probably yes, but not so simply. The striking association of large gains around the median of the global income distribution – received mostly by the Asian populations – and the stagnation of incomes among the poor or lower middle classes in rich countries, naturally opens the question of whether the two are associated. Does the growth of China and India take place on the back of the middle class in rich countries? There are many studies that, for particular types of workers, discuss the substitutability between rich countries’ low-skilled labour and Asian labour embodied in traded goods and services or outsourcing. Global income data do not allow us to establish or reject the causality. But they are quite suggestive that the two phenomena may be related.
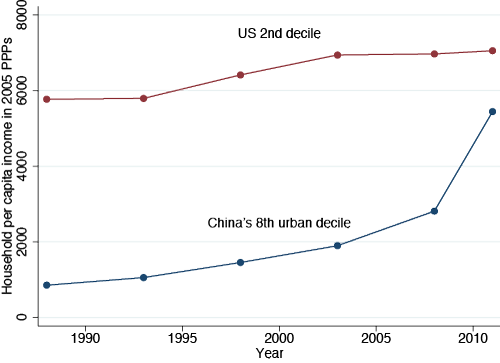
A dramatic way to see the change brought by globalisation is to compare the evolution over time of the 2nd US income decile with (say) the Chinese urban 8th decile (Figure 3). Indeed we are comparing relatively poor people in the US with relatively rich people in China, but given the income differences between the two countries, and that the two groups may be thought to be in some kind of global competition, the comparison makes sense. Here we extend the analysis to 2011, using more recent and preliminary data. While the real income of the US 2nd decile has increased by some 20% in a quarter century, the income of China’s 8th decile has been multiplied by a factor of 6.5. The absolute income gap, still significant five years ago, before the onset of the Great Recession, has narrowed substantially.
Political Implications
And even if the causality cannot be established because of many technical difficulties and an inability to define credible counterfactuals, the association between the two cannot pass unnoticed. What, then, are its implications? First, will the bottom incomes of the rich countries continue to stagnate as the rest of China, or later Indonesia, Nigeria, India, etc. follow the upward movement of Chinese workers through the ranks of the global income distribution? Does this imply that the developments that are indeed profoundly positive from the global point of view may prove to be destabilising for individual rich countries?
Second, if we take a simplistic, but effective, view that democracy is correlated with a large and vibrant middle class, its continued hollowing-out in the rich world would, combined with growth of incomes at the top, imply a movement away from democracy and towards forms of plutocracy. Could then the developing countries, with their rising middle classes, become more democratic and the US, with its shrinking middle class, less?
Third, and probably the most difficult: What would such movements, if they continue for a couple of decades, imply for global stability? The formation of a global middle class, or the already perceptible ‘homogenisation’ of the global top 1%, regardless of their nationality, may be both deemed good for world stability and interdependency, and socially bad for individual countries as the rich get ‘delinked’ from their fellow citizens.
Conclusion
In a nutshell, the movements that we witness do not only lead to an economic rebalancing of the East and West – in which both may end up with global output shares close to what they had before the Industrial Revolution – but to a contradiction between the current world order, where political power is concentrated at the level of the nation-state, and the economic forces of globalization which have gone far beyond it.
References
Anand, Sudhir and Paul Segal (2008), “What Do We Know about Global Income Inequality?”, Journal of Economic Literature, 46(1): 57–94.
Lakner, Christoph and Branko Milanovic (2013), “Global income distribution: from the fall of the Berlin Wall to the Great Recession”, World Bank Working Paper No. 6719, December.
Can Democracy Help with Inequality?
Inequality is currently a prominent topic of debate in Western democracies. In democratic countries, we might expect rising inequality to be partially offset by an increase in political support for redistribution. This column argues that the relationship between democracy, redistribution, and inequality is more complicated than that. Elites in newly democratized countries may hold on to power in other ways, the liberalization of occupational choice may increase inequality among previously excluded groups, and the middle classes may redistribute income away from the poor as well as the rich.
There is a great deal of concern at the moment about the consequences of rising levels of inequality in North America and Western Europe. Will this lead to an oligarchisation of the political system, and imperil political and social stability? Many find such dynamics puzzling given that it is happening in democratic countries. In democratic societies, there ought to be political mechanisms that can inhibit or reverse large rises in inequality, most likely through the fiscal system. Indeed, one of the most central models in political economy, due originally to Meltzer and Richard (1981), suggests that high inequality in a democracy should lead the politically powerful (in their model the voter at the median of the income distribution) to vote for higher levels of taxes and redistribution, which would partially offset rising inequality.
But before asking about what happens in a democracy, we could start with some even more fundamental questions. Is it correct factually that democracies redistribute more income than dictatorships? When a country becomes democratic, does this tend to increase redistribution and reduce inequality? The existing scholarship on these questions, though vast, is quite contradictory. Historical studies, such as Acemoglu and Robinson (2000) and Lindert (2004), tend to suggest that democratization increases redistribution and reduces inequality. Using cross-national data, Gil et al. (2004) find no correlation between democracy as measured by the Polity score and any government spending or policy outcome. The evidence on the impact of democracy on inequality is similarly puzzling. An early survey by Sirowy and Inkeles (1990) concludes, “the existing evidence suggests that the level of political democracy as measured at one point in time tends not to be widely associated with lower levels of income inequality” (p. 151), though Rodrik (1999) finds that both the Freedom House and Polity III measures of democracy were positively correlated with average real wages in manufacturing and the share of wages in national income (in specifications that also control for productivity, GDP per capita, and a price index).

In a recent working paper (Acemoglu et al. 2013), we revisit these questions both theoretically and empirically.
Theoretical Nuances

Theoretically, we point out why the relationship between democracy, redistribution, and inequality may be more complex than the discussion above might suggest. First, democracy may be ‘captured’ or ‘constrained’. In particular, even though democracy clearly changes the distribution of de jure power in society, policy outcomes and inequality depend not just on the de jure but also the de facto distribution of power. Acemoglu and Robinson (2008) argue that, under certain circumstances, elites who see their de jure power eroded by democratization may sufficiently increase their investments in de facto power (e.g. via control of local law enforcement, mobilization of non-state armed actors, lobbying, and other means of capturing the party system) in order to continue to control the political process. If so, we would not see much impact of democratization on redistribution and inequality. Similarly, democracy may be constrained by other de jure institutions such as constitutions, conservative political parties, and judiciaries, or by de facto threats of coups, capital flight, or widespread tax evasion by the elite.
Democratization can also result in ‘inequality-increasing market opportunities’. Non-democracy may exclude a large fraction of the population from productive occupations (e.g. skilled occupations) and entrepreneurship (including lucrative contracts), as in Apartheid South Africa or the former Soviet Union. To the extent that there is significant heterogeneity within this population, the freedom to take part in economic activities on a more level playing field with the previous elite may actually increase inequality within the excluded or repressed group, and consequently the entire society.
Finally, consistent with Stigler’s ‘Director’s Law’ (1970), democracy may transfer political power to the middle class, rather than the poor. If so, redistribution may increase and inequality may be curtailed only if the middle class is in favour of such redistribution.
But what are the basic robust facts, and do they support any of these mechanisms?
Empirical Evidence

Cross-sectional (cross-national) regressions, or regressions that do not control for country fixed effects, will be heavily confounded with other factors likely to be simultaneously correlated with democracy and inequality. In our work we therefore focus on a consistent panel of countries, and investigate whether countries that become democratic redistribute more and reduce inequality relative to others. We also focus on a consistent definition of democratization based on Freedom House and Polity indices, building on the work by Papaioannou and Siourounis (2008).
One of the problems of these indices is the significant measurement error, which creates spurious movements in democracy. To minimize the influence of such measurement error, we create a dichotomous measure of democracy using information from both the Freedom House and Polity data sets, as well as other codings of democracies, to resolve ambiguous cases. This leads to a binary measure of democracy for 184 countries annually from 1960 (or post-1960 year of independence) to 2010. We also pay special attention to modeling the dynamics of our outcomes of interest – taxes as a percentage of GDP, and various measures of structural change and inequality.
Our empirical investigation uncovers a number of interesting patterns. First, we find a robust and quantitatively large effect of democracy on tax revenues as a percentage of GDP (and also on total government revenues as a percentage of GDP). The long-run effect of democracy in our preferred specification is about a 16% increase in tax revenues as a fraction of GDP. This pattern is robust to various different econometric techniques and to the inclusion of other potential determinants of taxes, such as unrest, war, and education.
Second, we find an effect of democracy on secondary school enrolment and the extent of structural transformation (e.g. an impact on the nonagricultural shares of employment and output).
Third, however, we find a much more limited effect of democracy on inequality. Even though some measures and some specifications indicate that inequality declines after democratization, there is no robust pattern in the data (certainly nothing comparable to the results on taxes and government revenue). This may reflect the poorer quality of inequality data. But we also suspect it may be related to the more complex, nuanced theoretical relationships between democracy and inequality pointed out above.
Fourth, we investigate whether there are heterogeneous effects of democracy on taxes and inequality consistent with these more nuanced theoretical relationships. The evidence here points to an inequality-increasing impact of democracy in societies with a high degree of land inequality, which we interpret as evidence of (partial) capture of democratic decision-making by landed elites. We also find that inequality increases following a democratisation in relatively nonagricultural societies, and also when the extent of disequalising economic activities is greater in the global economy as measured by US top income shares (though this effect is less robust). These correlations are consistent with the inequality-inducing effects of access to market opportunities created by democracy. We also find that democracy tends to increase inequality and taxation when the middle class are relatively richer compared to the rich and poor. These correlations are consistent with Director’s Law, which suggests that democracy allows the middle class to redistribute from both the rich and the poor to itself.
Conclusions

These results do suggest that some of our basic intuitions about democracy are right – democracy does represent a real shift in political power away from elites that has first-order consequences for redistribution and government policy. But the impact of democracy on inequality may be more limited than one might have expected.
This might be because recent increases in inequality are ‘market-induced’ in the sense of being caused by technological change. But at the same time, our work also suggests reasons why democracy may not counteract inequality. Most importantly, this may be because, as in the Director’s Law, the middle classes use democracy to redistribute to themselves. Nevertheless, since the increase in inequality in the US has been associated with a significant surge in the share of income accruing to the very rich, compared to both the middle class and the poor, Director’s Law-type mechanisms seem unlikely to be able to explain why policy has not changed to counteract this. Clearly other political mechanisms must be at work, the nature of which requires a great deal of research.
References
Acemoglu, Daron and James A Robinson (2000), “Why Did the West Extend the Franchise?”, Quarterly Journal of Economics, 115: 1167–1199.
Acemoglu, Daron and James A Robinson (2008), “Persistence of Power, Elites and Institutions”, The American Economic Review, 98: 267–291.
Daron Acemoglu, Suresh Naidu, Pascual Restrepo, and James A Robinson (2013), “Democracy, Redistribution and Inequality”, NBER Working Paper 19746.
Gil, Ricard, Casey B Mulligan, and Xavier Sala-i-Martin (2004), “Do Democracies have different Public Policies than Nondemocracies?”, Journal of Economic Perspectives, 18: 51–74.
Lindert, Peter H (2004), Growing Public: Social Spending and Economic Growth since the Eighteenth Century, New York: Cambridge University Press.
Meltzer, Allan M and Scott F Richard (1981), “A Rational Theory of the Size of Government”, Journal of Political Economy, 89: 914–927.
Papaioannou, Elias and Gregorios Siourounis (2008), “Democratisation and Growth”, Economic Journal, 118(532): 1520–1551.
Rodrik, Dani (1999), “Democracies Pay Higher Wages”, Quarterly Journal of Economics, 114: 707–738.
Sirowy, Larry and Alex Inkeles (1990), “The Effects of Democracy on Economic Growth and Inequality: A Review”, Studies in Comparative International Development, 25: 126–157.
Stigler, George J (1970), “Director’s Law of public income redistribution”, Journal of Law and Economics, 13: 1–10.


The Greatest Reshuffle of Individual Incomes since the Industrial Revolution
The effects of of globalization on income distributions in rich countries have been studied extensively. This column takes a different approach by looking at developments in global incomes from 1988 to 2008. Large real income gains have been made by people around the median of the global income distribution and by those in the global top 1%. However, there has been an absence of real income growth for people around the 80-85th percentiles of the global distribution, a group consisting of people in ‘old rich’ OECD countries who are in the lower halves of their countries’ income distributions.
The effects of trade, or more broadly of globalization, on incomes and their distribution in the rich countries have been much studied, beginning with a number of works on wage distributions in the 1990s, to more recent papers on the effects of globalization on the labour share (Karabarbounis and Neiman 2013, Elsby et al. 2013), wage inequality (Ebenstein et al. 2015), and routine middle class jobs (Autor and Dorn 2010).
In joint work with Christoph Lakner (Lakner and Milanovic 2015) and in a recently published book, Global Inequality: A New Approach for the Age of Globalization (Milanovic 2016), Milanovic take a different approach of looking at real incomes across the world population. This is made possible thanks to the data from almost 600 household surveys from approximately 120 countries in the world covering more than 90% of the world population and 95% of global GDP. Since household surveys are not available for all countries annually, the data are ‘centred’ on benchmark years, at five-year intervals, starting with 1988 and ending in 2008. I report the results for up to 2011 in Milanovic (2016), while Lakner has an unpublished update for 2013. The updates confirm, or reinforce, the key findings for 1988-2008 that I discuss here.
The advantage of a global approach resides in its comprehensiveness and the ability to observe and analyze the effects of globalization in many parts of the world and on many parts of the global income distribution. While the true or putative effects of globalization on working class incomes in the rich world have become the object of fierce political battles – especially in the wake of the Brexit vote and the rise of Donald Trump to political prominence in the US – the overall effects of globalization on the rest of the world have received less attention, and when they have, were studied separately, as if independent, from the effects observed in the rich word.
Figure 1 – dubbed by some ‘the elephant graph’ because of its shape – shows real income gains realized at different percentiles of the global income distribution between 1988 and 2008. Income is measured in 2005 international dollars and individuals are ranked by their real household per capita income. The results show large real income gains made by the people around the global median (point A) and by those who are part of the global top 1% (point C). It also shows an absence of real income growth for the people around the 80-85th percentile of the global distribution (point B).
Who are the people at these three key points? Nine out of ten people around the global median are from Asian countries, mostly from China and India. Their gains are not surprising, given that Chinese and Indian GDP per capita has increased by 5.6 and 2.3 times, respectively, over the period. Thus, for example, the person at the median of the Chinese urban distribution in 1988 was then also at the global median, but rose to the 63rd global percentile in 2008 and was above the 70th percentile in 2011. She thus leapfrogged, in terms of income, some 1.5 billion individuals. Such dramatic changes in relative income positions, over a rather short time period, have not occurred since the Industrial Revolution two centuries ago.
The people around the global median are, however, still relatively poor by Western standards. This emerging ‘global middle class’ is composed of individuals with household per capita incomes of between 5 and 15 international dollars per day. To put these numbers into perspective, one should recall that the national poverty lines in rich countries are often higher than 15 dollars per person per day.
The global top 1% is composed overwhelmingly of the people from the advanced economies – one half of the people in that group are Americans, or differently put, 12% of Americans are part of the global top 1%. China and India have many billionaires (in effect, according to the 2015 Forbes list, China and India have more than 300 billionaires versus more than 500 for the US), but compared to the ‘old rich’ world, Asian countries still do not have sufficient numbers of ‘comfortably rich’ or affluent households. In 2008, the threshold for being in the global top 1% was 45,000 international dollars per person per year which, translated into a traditional family structure of two partners and two children, implies an after-tax income of $180,000 (or, using the approximate tax rates of the rich countries, a before-tax income of more than $300,000).
The point that attracts most attention is B. Seven out of ten people at that point are from the ‘old rich’ OECD countries. They belong to the lower halves of their countries’ income distributions, for in effect the rich countries’ income distributions start only around the 70th percentile of the global income distribution. (For some especially rich and egalitarian advanced economies, that start-up point is even higher – Denmark’s distribution begins around the 80th global percentile.)
The contrast between the unambiguous success of people at point A and the relative failure of people at point B allows us to look at the effects of globalization more broadly. Not only can we see them more clearly when thus juxtaposed, but it enables us to ask whether the two points are in some sense related: is the absence of growth among lower middle classes of the rich world the ‘cost’ paid for the high income gains of the national middle classes in Asia? It is unlikely that one can provide a definitive answer to that question, since establishing causality between such complex phenomena that are also affected by a host of other variables is very difficult and perhaps impossible. However, the temporal coincidence of the two developments and the plausible narratives linking them, whether made by economists or by politicians, make the correlation in many people’s mind appear real.
In addition to looking at the global reshuffle of income through the nation-state lenses (are the ‘losses’ of UK working class related to the gains of the Chinese?), we can look at it through a purely cosmopolitan lens where all individuals are treated equally, and the same-percentage income gains realized by the poorer people are valued more than those made by the rich. With such a perspective in mind, it would be hard to dismiss the period 1988-2008 (and as our results for up to 2013 confirm, the period all the way to the present) as being one of failure. One could, despite the rising income share of the global top 1%, argue the opposite by pointing to the close to doubling of real incomes realized by some one-fifth of the world population that lies between the 45th and 65th global percentiles. It is their real income growth that has driven the first decline in global inequality since the Industrial Revolution (Milanovic 2016, Chapter 1).
The issue, however, is that such a cosmopolitan approach is a very abstract way to look at the matters of distribution. Most people are concerned with their incomes as compared to their national peers. Milanovic and Roemer (2016) show that what seems a very positive development (that is, lower global inequality) when individuals are assumed to be concerned solely with their absolute incomes becomes much less positive when we also include in their welfare functions a concern with relative positions in national income distributions. Then the dominant feeling across the world, reflecting increasing national income inequalities, becomes one of a relative loss.
The political implications of a global ‘elephant graph’ are being played out in national political spaces. In that space, rising national inequalities, despite being accompanied by lower global poverty and inequality, may turn out to be difficult to manage politically.
References
Autor, D. and D. Dorn (2010), “The growth of low-skill service jobs and the polarization of US labor market”, American Economic Review 103(5): 1553-97.
Ebenstein, A., A. Harrison, M. McMillan and S. Phillips (2014), “Estimating the Impact of Trade and Offshoring on American Workers Using the Current Population Surveys”, Review of Economics and Statistics 96(4): 581–595.
Elsby, M. W. L., B. Hobijn, and A. Şahin (2013), “The Decline of US Labor Share,” paper prepared for the Brookings Panel on Economic Activity, September 2013.
Karabarbounis, L. and B. Neiman (2013), “The Global Decline of the Labor Share”, Quarterly Journal of Economics 129(1): 61–103.
Lakner, C. and B. Milanovic (2015), “Global income distribution: from the fall of the Berlin Wall to the Great Recession”, World Bank Economic Review 30(2): 203-232.
Milanovic, B. (2016), Global Inequality: A New Approach for the Age of Globalization, Harvard University Press.
Milanovic, B. and J. Roemer (2016), “Interaction of global and national income inequalities”, Journal of Globalization and Development, forthcoming.
Source: